

By: Erik Stoltz I Bitcoin Omnia
February 23, 2026
___________________________________________________________________
In the famous words of French author Jean-Baptiste, “the more things change, the more they stay the same.” I can’t think of a better quote to encapsulate Bitcoin’s run over the last 5 months. The more we analyze, dissect and attempt to define the world’s most enigmatic asset, the more it behaves as it always has; unpredictable, volatile and unforgiving. While bulls were running their ceremonial victory laps heading into October 2025, Bitcoin has since plunged 44%, to around $70,000 per coin in mid-February 2026. Sacré bleu!
My first article for Bitcoin Omnia attempts to identify the five primary drivers behind this market correction, through capital flows, institutional positioning indicators, and changing narratives.
Factor #1: Collapse of the Basis Trade
Hedge Fund Arbitrage Unwind
What is the Bitcoin basis trade you ask? At its peak in 2024, the Bitcoin basis trade delivered annualized returns of 17%, simply by buying spot Bitcoin through the ETF’s and shorting Bitcoin futures. By early 2026, these yields had compressed to below 5%, barely exceeding the execution costs and the risk-free rate of short-term U.S. Treasuries.
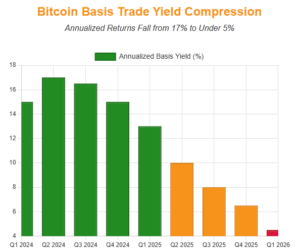
By late December 2025, Bitcoin futures open interest on the CME fell below open interest on Binance’s exchange for the first time since 2023, further explaining institutional capital fleeing an unprofitable arbitrage play. When hedge funds are forced to sell spot Bitcoin holdings via the ETF to cover short futures positions, it further exacerbates a sell-off exceeding organic demand for IBIT and other Bitcoin ETF’s
Currently, it is estimated that hedge funds represent 10-20% of the total Bitcoin ETF position holders, which would mean coordinated or systematic position unwinding can dominate short term flows and price action. More on this in factor #4.
Factor #2: Institutional ETF Outflows & The IBIT Exodus
The ~$6+ Billion Capital Flight
On October 6, 2025 Blackrock’s iShares Bitcoin Trust (IBIT) recorded a single-day net inflow of $970 million. Since then, spot Bitcoin ETF’s have lost nearly $6.18 billion in net capital. The chart below says it all.
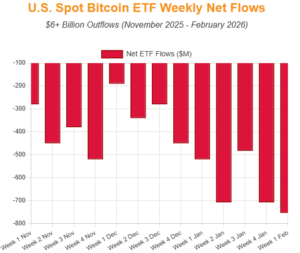
Due to the structure of the ETF products, fund redemptions force authorized participants to sell actual Bitcoin to meet those redemption quests, directly affecting spot price. Unlike discretionary selling, this is mechanical and non-negotiable. Perhaps more concerning, is Bitcoin spot price crossing the average cost basis barrier. For investors that piled into Bitcoin ETF’s in early 2024, they are still sitting on 100% gains if they held their positions. However, an estimated 60% of inflows into the Bitcoin ETF’s occurred within the spot price range of $85,000-$90,000, leaving them in total unrealized loss territory of nearly $7 billion in aggregate.
If there is a silver lining, it is retail ETF investors tend to invest with a long-term mentality, many seeing draw downs as discounted buying opportunities.
Factor #3: The Kevin Warsh Fed Chair Nomination
Hawkish Monetary Policy Shock
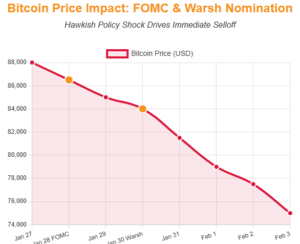
On January 30th, President Trump released a formal White House announcement, nominating Kevin Warsh as the next Federal Reserve chair. While the nomination still requires Senate confirmation, Warsh is now in line to replace Jerome Powell as the next Federal Reserve Chair.
At the time of the announcement, Bitcoin was already in a price slide, silver and gold continued their sell offs from all time highs, while stocks rattled intraday before stabilizing. What’s curious is not the market’s initial reaction, but the choice in the new Fed chair based on Trump’s incessant calls for easing monetary policy. Warsh is notoriously hawkwish. He was a vocal critic of Ben Bernanke’s handling of certain aspects of the 2008 financial crisis, particularly prolonged use of quantitative easing and massive expansion of the Fed’s balance sheet, which he felt went beyond immediate crisis response.
Without knowing much about other potential candidates, one would think Trump would have nominated a candidate with a dovish background in favor of loose monetary policy. But, considering the nomination, a couple things come to mind. First, Warsh still requires Senate approval for nomination, perhaps he’s seen as a compromise because of his more conservative monetary principles that won’t come off as suspicious versus a selection who outwardly bends to Trump’s demands for lower Fed Fund rates. Also, his outward contention of the Fed having too much power and influence in the markets post 2008, aligns with the sentiment of Treasury Secretary Bessent, that the Fed’s independence is jeopardized through excessive intervention, harming efficient market functioning and economic stability.
One thing is for certain, the next Fed Chair faces an impossible task. A strong dollar is needed for the U.S. to maintain world reserve currency status, as it’s our strongest export. It attracts foreign capital to treasuries and helps fund our deficits. On the other hand, we need lower interest rates to refinance our $38 trillion national debt, stimulate growth, and boost asset prices to offset the aforementioned debt. You can’t have both, so which is it?
Factor #4: Leveraged Liquidation Cascade
IBIT Options Gamma Trap – Hong Kong Hedge Fund Blowup to Blame?
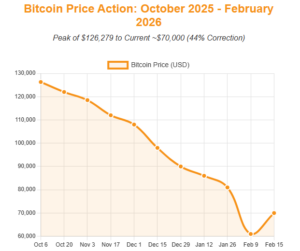
Down and to the right, are we having fun yet? On February 5th, Bitcoin crashed nearly $15,000 in 24 hours. This was the largest 24 hour loss period on a percentage basis since the FTX collapse on November 9, 2022. There were rumors circulating that a Hong-Kong based hedge fund(s) associated with $DVDV holdings, running highly leveraged options strategies with IBIT blew up. Of course, there is no way to verify this until next quarter’s 13F filings, but this is what the market data shows during this time period:
- On February 5,IBIT recorded it’s largest trading volume ever of $10.7 billion
- Options premiums hit a record of $900 million on the same day
- Total option contracts of 2.33 million shattered the old record
- Approximately $2.7 billion in leveraged long positions were liquidated market-wide
Let’s infer, based on market setup, what likely caused this massive one-day draw down. Considering the common hedge fund strategy from Factor #1, it is possible large institutional players were still implementing the Yen carry trade (borrow cheap Yen to purchase higher yielding assets) in its final stages, and taking on extreme leveraged bets on Bitcoin to recover its October price levels. During that time, yields on Japanese short term debt spiked in a short window, only compounding further losses. That, coupled with the simultaneous 30% draw down of silver, put the nail in the coffin for an entity trading with extreme leverage.
Again, we cannot confirm which, or if any particular entity had this happen, but all of these market variables likely played some role in cascading effects leading to Bitcoin’s largest 24 hour draw down in nearly 5 years.
Factor #5: Cross-Asset Contagion
The Breakdown of Bitcoin’s Hedge Narrative
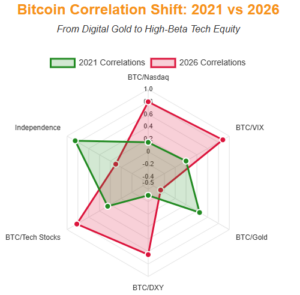
Since correlative asset data can be measured objectively, we’ve started to see a fracture in one of Bitcoin’s core narratives. Bitcoin’s correlation to risk assets reached historic highs precisely when Bitcoin holders anticipated a divergence in the middle of last year. Instead of rallying alongside gold amidst tariff wars and geopolitical uncertainty, Bitcoin amplified equity market volatility moving in lockstep with small-cap tech stock, and giving way to gold’s ascension. The correlation data is clear:
- Bitcoin’s 30-day correlation with the Nasdaq peaked at 0.80 (highest on record)
- Bitcoin volatility/VIX correlation at 0.88. Fear and uncertainty are driving prices lower.
- Since 2021, Bitcoin’s correlation to equities increased from 0.15 to 0.75 in 2026.
- Bitcoin is now negatively correlated to gold -0.27 after latest price moves.
Clearly, the market is now pricing Bitcoin as a risk on/tech correlated asset. Is it fair to say that Bitcoin is no longer an inflation hedge, even with its perfectly inelastic supply, after a big sell off over the last 5 months? Maybe, and maybe not. What it does show is one correction can drastically change the underlying market data of an asset, especially one as misunderstood as Bitcoin. In the short and intermediate terms, underlying perception on Wall Street, and trending market sentiment will influence trading behavior. But underlying sentiment, compared to growing infrastructure and regulatory clarity designed to support broader Bitcoin adoption are telling two different stories now. This is what an asymmetric opportunity looks like as an asset allocator and investor.
Key Takeaways & Discussion Points
The latest Bitcoin drawdown, appears to represent a structural repricing over a temporary pullback. This correction has exposed Bitcoin’s maturity gap, relative to other widely accepted forms of “hard money” during times of economic uncertainty. While institutional infrastructure exists and regulatory clarity is within reach, Bitcoin is still behaving like a high-beta equity.
Client Conversation Points:
- Bitcoin is NOT currently functioning as digital gold, high NASDAQ correlation at .80.
- Monetary policy has not been as accommodative as anticipated.
- Leverage played a role in reaching the all time highs and latest lows.
- Bitcoin is in a maturation process, separating long term allocators from speculators and early adopters realizing capital gains.
Bitcoin Omnia
Research-driven Bitcoin guidance for advisors, family offices, and financial institutions
bitcoinomnia.com
Disclaimer:
This analysis is provided for educational purposes and does not constitute investment advice. Bitcoin is a volatile asset. Advisors should conduct their own due diligence and consider their clients’ individual circumstances before making allocation recommendations.